Debugging and Profiling
ပရိုဂရမ်မင်းတွင် ရွှေရောင် စည်းမျဉ်းတစ်ခု ရှိသည်မှာ - Code သည် သင်မျှော်လင့်သလို အလုပ်လုပ်မည် မဟုတ်ဘဲ သင်ခိုင်းစေသည့်အတိုင်းသာ အလုပ်လုပ်မည် ဖြစ်သည်။ ထို ကွာဟချက်ကို ပေါင်းကူးပေးရန်မှာ အချို့သော အခြေအနေများတွင် အလွန် ခက်ခဲသော စိန်ခေါ်မှု ဖြစ်နိုင်ပါသည်။ ဤသင်ခန်းစာတွင် Bug ပါဝင်နေသော Code များနှင့် Resource စားသုံးမှု များပြားနေသော Code များကို ကိုင်တွယ် ဖြေရှင်းနိုင်မည့် အသုံးဝင်သော နည်းလမ်းနှစ်ခုဖြစ်သည့် Debugging ပြုလုပ်ခြင်း နှင့် Profiling ပြုလုပ်ခြင်း တို့ကို သင်ကြားပေးသွားမည် ဖြစ်ပါသည်။
Debugging
Printf debugging and Logging
“ထိရောက်မှု အရှိဆုံး Debugging tool မှာ သေချာစွာ စဉ်းစားတွေးခေါ်ခြင်း ဖြစ်ပြီး ယင်းနှင့်အတူ သင့်တော်ရာ နေရာများ၌ ထည့်သွင်းထားသော print စာကြောင်းများ ဖြစ်သည်” — Brian Kernighan, Unix for Beginners.
ပရိုဂရမ်တစ်ခုကို Debug ပြုလုပ်ရန် ပထမဆုံး နည်းလမ်းမှာ ပြဿနာ တွေ့ရှိရသည့် နေရာများ၌ print စာကြောင်းများ ထည့်သွင်းပြီး ပြဿနာ ဖြစ်ပွားရခြင်း အကြောင်းအရင်းကို နားလည်စေရန် အချက်အလက် လုံလောက်စွာ ရရှိသည်အထိ အကြိမ်ကြိမ် စမ်းသပ်ခြင်း ဖြစ်သည်။
ဒုတိယ နည်းလမ်းမှာ တိုက်ရိုက် print စာကြောင်းများ ရေးသားမည့်အစား သင်၏ ပရိုဂရမ်တွင် Logging ကို အသုံးပြုခြင်း ဖြစ်ပါသည်။ Logging ကို အသုံးပြုခြင်းသည် သာမန် print စာကြောင်းများထက် အကြောင်းကြောင်းကြောင့် ပိုမို ကောင်းမွန်ပါသည် -
- Standard Output သို့ မဟုတ်ဘဲ ဖိုင်များ၊ Socket များ သို့မဟုတ် Remote Server များထံသို့ Log များကို သိမ်းဆည်း ပေးပို့နိုင်ပါသည်။
- Logging သည် သင့်တော်သလို Filter လုပ်နိုင်စေရန် Severity levels များ (ဥပမာ INFO, DEBUG, WARN, ERROR အစရှိသည်) ကို ထောက်ပံ့ပေးပါသည်။
- ပြဿနာ အသစ်များ ဖြစ်ပေါ်သည့်အခါ သင်၏ Log များတွင် မည်သည် မှားယွင်းနေကြောင်း သိရှိနိုင်မည့် အချက်အလက် လုံလောက်စွာ ပါဝင်နိုင်ခြေ ရှိပါသည်။
ဒီနေရာတွင် Log စာတိုများ ရေးသားထားသော နမူနာ Python Code ကို တွေ့နိုင်ပါသည် -
$ python logger.py
# Raw output as with just prints
$ python logger.py log
# Log formatted output
$ python logger.py log ERROR
# Print only ERROR levels and above
$ python logger.py color
# Color formatted output
Log များကို ပိုမို ဖတ်ရှုရ လွယ်ကူစေရန် ကျွန်ုပ် အနှစ်သက်ဆုံး အကြံပြုချက်တစ်ခုမှာ အရောင်များ (Color code) တပ်ဆင်ခြင်း ဖြစ်ပါသည်။
သင်၏ Terminal တွင် အရာရာကို ဖတ်ရှုရ လွယ်ကူစေရန် အရောင်များ အသုံးပြုထားသည်ကို သတိပြုမိပေမည်။ သို့သော် ၎င်းသည် မည်သို့ အလုပ်လုပ်သနည်း။
ls သို့မဟုတ် grep ကဲ့သို့သော ပရိုဂရမ်များသည် Terminal အား Output ၏ အရောင်ပြောင်းလဲရန် ညွှန်ကြားသည့် အထူး စာလုံး အစဉ်လိုက်များ ဖြစ်သော ANSI escape codes များကို အသုံးပြုကြပါသည်။ ဥပမာအားဖြင့် echo -e "\e[38;2;255;0;0mThis is red\e[0m" ကို runလိုက်ပါက သင်၏ Terminal က true color ကို ထောက်ပံ့ပါက This is red ဟူသော စာတိုကို အနီရောင်ဖြင့် ပြသမည် ဖြစ်သည်။ အကယ်၍ Terminal က ထောက်ခံမှု မရှိပါက (ဥပမာ macOS ၏ Terminal.app) ပိုမို အထွေထွေ ထောက်ပံ့သော အရောင် ၁၆ ရောင် Escape code ကို သုံးနိုင်ပါသည်၊ ဥပမာ echo -e "\e[31;1mThis is red\e[0m"။
အောက်ပါ Script သည် သင်၏ Terminal အတွင်းသို့ RGB အရောင်များစွာ ရိုက်နှိပ်ပြသပုံကို ဖော်ပြထားပါသည် (True color ထောက်ပံ့ပါက)။
#!/usr/bin/env bash
for R in $(seq 0 20 255); do
    for G in $(seq 0 20 255); do
        for B in $(seq 0 20 255); do
            printf "\e[38;2;${R};${G};${B}m█\e[0m";
        done
    done
done
Third party logs
ပိုမို ကြီးမားသော Software စနစ်များကို တည်ဆောက်လာသည့်အခါ သီးခြား ပရိုဂရမ်များအဖြစ် runနေသော Dependencies များနှင့် ကြုံတွေ့ရမည် ဖြစ်ပါသည်။ Web server များ၊ Database များ သို့မဟုတ် Message broker များသည် ဤကဲ့သို့သော Dependency များ၏ အသုံးများသော ဥပမာများ ဖြစ်ကြသည်။ ဤစနစ်များနှင့် မကြာခဏ ချိတ်ဆက် ဆောင်ရွက်သည့်အခါ Client side error စာတိုများ လုံလောက်မှု မရှိနိုင်သဖြင့် ယင်းတို့၏ Log များကို ဖတ်ရှုရန် လိုအပ်တတ်ပါသည်။
ကံကောင်းစွာပင် ပရိုဂရမ် အများစုသည် ယင်းတို့၏ မူပိုင် Log များကို သင်၏ စနစ်အတွင်း တစ်နေရာရာ၌ ရေးသားလေ့ ရှိကြသည်။
UNIX စနစ်များတွင် ပရိုဂရမ်များသည် Log များကို /var/log အောက်၌ ရေးသားခြင်းမှာ အလေ့အထ ဖြစ်သည်။
ဥပမာအားဖြင့် NGINX Webserver သည် ယင်း၏ Log များကို /var/log/nginx အောက်တွင် ထားရှိသည်။
နောက်ပိုင်းတွင် စနစ်များသည် system log ကို စတင် အသုံးပြုလာကြပြီး သင်၏ Log စာတို အားလုံး ရောက်ရှိရာ နေရာ ဖြစ်လာပါသည်။
Linux စနစ် အများစု (အားလုံးတော့ မဟုတ်ပါ) သည် သင်၏ စနစ်ရှိ Service များ ဖွင့်ထားခြင်း၊ runနေခြင်း အစရှိသည်တို့ကို ထိန်းချုပ်သော System Daemon ဖြစ်သည့် systemd ကို အသုံးပြုကြသည်။
systemd သည် Log များကို /var/log/journal အောက်တွင် သီးသန့် Format ဖြင့် ထားရှိပြီး journalctl Command ကို အသုံးပြု၍ မက်ဆေ့ဂျ်များကို ပြသနိုင်ပါသည်။
အလားတူ macOS တွင် /var/log/system.log ရှိနေဆဲ ဖြစ်သော်လည်း tools အမြောက်အမြားသည် System log ကို သုံးလာကြပြီး log show ဖြင့် ကြည့်ရှုနိုင်ပါသည်။
UNIX စနစ် အများစုတွင် Kernel log များကို ကြည့်ရှုရန် dmesg Command ကိုလည်း အသုံးပြုနိုင်ပါသည်။
System log များအောက်တွင် Logging ပြုလုပ်ရန် logger ဟူသော Shell program ကို အသုံးပြုနိုင်ပါသည်။
အောက်တွင် logger ကို အသုံးပြုပုံနှင့် System log သို့ ရောက်ရှိသွားခြင်း ရှိမရှိ စစ်ဆေးပုံ နမူနာကို ဖော်ပြထားပါသည်။
ထို့ပြင် ပရိုဂရမ်မင်း ဘာသာစကား အများစုတွင် System log ထို့သို့ ရေးသားရန် Bindings များ ပါရှိကြပါသည်။
logger "Hello Logs"
# On macOS
log show --last 1m | grep Hello
# On Linux
journalctl --since "1m ago" | grep Hello
Data wrangling သင်ခန်းစာတွင် တွေ့မြင်ခဲ့သည့်အတိုင်း Log များသည် အလွန် ရှည်လျား များပြားနိုင်ပြီး လိုချင်သော အချက်အလက် ရရှိရန် စစ်ထုတ်မှု (filter) ပြုလုပ်ရန် လိုအပ်ပါသည်။
journalctl နှင့် log show တို့တွင် များစွာ Filter လုပ်နေရပါက ယင်းတို့၏ Output ကို ပထမအဆင့် စစ်ထုတ်ပေးနိုင်သော Flag များကို အသုံးပြုရန် စဉ်းစားနိုင်ပါသည်။
ထို့အပြင် Log ဖိုင်များကို ပိုမို ကောင်းမွန်စွာ ပြသပေးပြီး ကြည့်ရှုနိုင်စေသော lnav ကဲ့သို့သော Tool များလည်း ရှိကြပါသည်။
Debuggers
Printf debugging သည် မလုံလောက်တော့သည့်အခါ Debugger တစ်ခုကို အသုံးပြုသင့်ပါသည်။ Debugger ဆိုသည်မှာ ပရိုဂရမ်၏ runနေမှုကို ချိတ်ဆက် ကွပ်ကဲနိုင်သော ပရိုဂရမ် ဖြစ်ပြီး အောက်ပါတို့ကို ပြုလုပ်နိုင်ပါသည် -
- သီးခြား စာကြောင်းသို့ ရောက်ရှိသောအခါ ပရိုဂရမ်၏ အလုပ်လုပ်နေမှုကို ခေတ္တ ရပ်တန့်ခြင်း။
- ပရိုဂရမ်ကို ညွှန်ကြားချက် တစ်ခုချင်းစီအလိုက် တဆင့်ချင်းစီ (step-by-step) သွားရောက်ခြင်း။
- ပရိုဂရမ် ပျက်စီး (crash) သွားပြီးနောက် Variable များ၏ တန်ဖိုးများကို စစ်ဆေးခြင်း။
- သတ်မှတ်ထားသော အခြေအနေ ကိုက်ညီသည့်အခါ ရပ်တန့်ခြင်း။
- နှင့် အခြား အဆင့်မြင့် အင်္ဂါရပ်များစွာ။
ပရိုဂရမ်မင်း ဘာသာစကား အများစုတွင် Debugger တစ်မျိုးမျိုး ပါဝင်လေ့ ရှိကြပါသည်။
Python တွင် ယင်းသည် Python Debugger pdb ဖြစ်ပါသည်။
pdb က ထောက်ပံ့ပေးသော Command အချို့၏ အတိုချုပ် ရှင်းလင်းချက်မှာ အောက်ပါအတိုင်း ဖြစ်ပါသည် -
- l(ist) - လက်ရှိ စာကြောင်း ဘေးပတ်ပတ်လည် ၁၁ ကြောင်းကို ပြသမည်။
- s(tep) - လက်ရှိ စာကြောင်းကို runပြီး ပထမဆုံး ရနိုင်သော နေရာတွင် ရပ်မည်။
- n(ext) - လက်ရှိ function ၏ နောက် စာကြောင်း ရောက်သည်အထိ သို့မဟုတ် Return ပြန်သည်အထိ ဆက်သွားမည်။
- b(reak) - Breakpoint သတ်မှတ်မည်။
- p(rint) - လက်ရှိ Context တွင် Expression ကို တွက်ချက်ပြမည်။
pprintသုံးလိုပါက pp လည်း ရှိသည်။ - r(eturn) - လက်ရှိ function return ပြန်သည်အထိ ဆက်လက် runမည်။
- q(uit) - Debugger မှ ထွက်မည်။
အောက်ပါ Bug ပါဝင်သော Python Code ကို ပြင်ဆင်ရန် pdb ကို အသုံးပြုပုံ နမူနာကို လေ့လာကြည့်ပါ။ (သင်ခန်းစာ ဗီဒီယိုကို ကြည့်ပါ)။
def bubble_sort(arr):
    n = len(arr)
    for i in range(n):
        for j in range(n):
            if arr[j] > arr[j+1]:
                arr[j] = arr[j+1]
                arr[j+1] = arr[j]
    return arr

print(bubble_sort([4, 2, 1, 8, 7, 6]))
Python သည် Interpreted language ဖြစ်သောကြောင့် pdb shell ကို အသုံးပြု၍ Command များ နှင့် Instruction များကို runနိုင်သည်ကို သတိပြုပါ။
ipdb သည် IPython REPL ကို အသုံးပြုထားသည့် ပိုမိုကောင်းမွန်သော pdb ဖြစ်ပြီး Tab completion, Syntax highlighting, Tracebacks များကို ပေးစွမ်းနိုင်ပါသည်။
Low-level programming အတွက်ဆိုလျှင် gdb (နှင့် ယင်း၏ pwndbg) သို့မဟုတ် lldb တို့ကို ကြည့်ရှုလိုပါလိမ့်မည်။
ယင်းတို့သည် C-like ဘာသာစကား Debugging အတွက် အထူးပြုထားသော်လည်း မည်သည့် Process ကိုမဆို စစ်ဆေးနိုင်ပြီး လက်ရှိ စက်၏ အခြေအနေဖြစ်သော Registers, Stack, Program Counter အစရှိသည်တို့ကို ရယူနိုင်ပါသည်။
Specialized Tools
သင် Debug ပြုလုပ်ရန် ကြိုးစားနေသည်မှာ Black box binary တစ်ခု ဖြစ်နေသည့်တိုင် အကူအညီပေးနိုင်သော Tool များ ရှိပါသည်။
ပရိုဂရမ်များသည် Kernel သာ ပြုလုပ်နိုင်သော လုပ်ဆောင်ချက်များကို ဆောင်ရွက်ရန် လိုအပ်သည့်အခါ System Calls များကို အသုံးပြုကြသည်။
သင်၏ ပရိုဂရမ် ပြုလုပ်သော Syscall များကို ခြေရာခံပေးသည့် Command များ ရှိပါသည်။ Linux တွင် strace ရှိပြီး macOS နှင့် BSD တွင် dtrace ရှိပါသည်။ dtrace သည် ယင်း၏ မူပိုင် D ဘာသာစကားကို သုံးသဖြင့် သုံးရခက်ခဲနိုင်သော်လည်း strace နှင့် ပိုမို တူညီသော Wrapper ဖြစ်သည့် dtruss ရှိပါသည် (အသေးစိတ်ကို ဒီမှာ ကြည့်ပါ)။
အောက်တွင် ls ၏ runမှုအတွက် stat syscall trace များကို ပြသရန် strace သို့မဟုတ် dtruss ကို အသုံးပြုပုံ နမူနာကို ဖော်ပြထားပါသည်။ strace ကို ပိုမို အသေးစိတ် လေ့လာရန် ဤဆောင်းပါး နှင့် ဤ zine တို့သည် ဖတ်ရှုရန် ကောင်းမွန်ပါသည်။
# On Linux
sudo strace -e lstat ls -l > /dev/null
# On macOS
sudo dtruss -t lstat64_extended ls -l > /dev/null
အချို့သော အခြေအနေများတွင် သင်၏ ပရိုဂရမ်ရှိ ပြဿနာကို ရှာဖွေရန် Network packets များကို ကြည့်ရှုရန် လိုအပ်နိုင်ပါသည်။
tcpdump နှင့် Wireshark ကဲ့သို့သော Tool များသည် Network packet များ၏ ပါဝင်ပုံကို ဖတ်ရှုနိုင်ပြီး စစ်ထုတ်ပေးနိုင်သော Network packet analyzer များ ဖြစ်ကြပါသည်။
Web development အတွက် Chrome/Firefox ၏ Developer tools များသည် အလွန် အဆင်ပြေပါသည်။ ယင်းတို့တွင် အသုံးဝင်သော Tool များစွာ ပါဝင်ပါသည် -
- Source code - မည်သည့် ဝဘ်ဆိုက်၏ HTML/CSS/JS source code ကိုမဆို စစ်ဆေးခြင်း။
- Live HTML, CSS, JS modification - စမ်းသပ်ရန်အတွက် ဝဘ်ဆိုက် အကြောင်းအရာ၊ ပုံစံ၊ အမူအကျင့်များကို ပြောင်းလဲခြင်း။
- Javascript shell - JS REPL တွင် Command များ runခြင်း။
- Network - Request များ၏ အချိန်ဇယားကို ဆန်းစစ်ခြင်း။
- Storage - Cookies နှင့် Local application storage များကို ကြည့်ရှုခြင်း။
Static Analysis
အချို့သော ပြဿနာများအတွက် မည်သည့် Code ကိုမျှ runရန် မလိုပါ။ ဥပမာအားဖြင့် Code ကို သေချာ ကြည့်ရုံဖြင့် သင်၏ Loop variable သည် ရှိပြီးသား Variable သို့မဟုတ် Function အမည်ကို ဖုံးအုပ် (shadowing) နေသည်ကို သို့မဟုတ် သတ်မှတ်ခြင်း မပြုမီ Variable ကို ဖတ်နေသည်ကို တွေ့ရှိနိုင်ပါသည်။ ဤနေရာတွင် static analysis tool များ ရောက်ရှိလာပါသည်။ Static analysis ပရိုဂရမ်များသည် Source code ကို လက်ခံပြီး ယင်း၏ မှန်ကန်မှုကို သုံးသပ်ရန် Coding rules များကို သုံး၍ စန်းစစ်ပေးပါသည်။
အောက်ပါ Python snippet တွင် အမှားများစွာ ပါဝင်နေသည်။
ပထမဦးစွာ Loop variable foo သည် မူလ function သတ်မှတ်ချက် foo ကို Shadowing ပြုလုပ်သွားသည်။ ထို့အပြင် နောက်ဆုံး စာကြောင်းတွင် bar အစား baz ဟု ရေးသားမိသဖြင့် (၁ မိနစ် ကြာမြင့်မည့်) sleep ပြီးနောက် ပရိုဂရမ် Crash ဖြစ်သွားပါမည်။
import time

def foo():
    return 42

for foo in range(5):
    print(foo)

bar = 1
bar *= 0.2
time.sleep(60)
print(baz)
Static analysis tool များသည် ဤကဲ့သို့သော ပြဿနာများကို ရှာဖွေပေးနိုင်ပါသည်။ pyflakes ကို runလိုက်ပါက Bug နှစ်ခုစလုံးနှင့် ပတ်သက်သော Error များကို ရရှိမည် ဖြစ်သည်။ mypy သည် Type စစ်ဆေးမှု ပြဿနာများကို ရှာဖွေပေးနိုင်သော အခြား Tool ဖြစ်ပါသည်။ ဤနေရာတွင် mypy က bar သည် မူလက int ဖြစ်ပြီး နောက်ပိုင်း float သို့ ပြောင်းလဲသွားကြောင်း သတိပေးမည် ဖြစ်သည်။
ဤပြဿနာ အားလုံးကို Code ကို runစရာ မလိုဘဲ စစ်ဆေးတွေ့ရှိခဲ့ခြင်း ဖြစ်သည်ကို သတိပြုပါ။
$ pyflakes foobar.py
foobar.py:6: redefinition of unused 'foo' from line 3
foobar.py:11: undefined name 'baz'

$ mypy foobar.py
foobar.py:6: error: Incompatible types in assignment (expression has type "int", variable has type "Callable[[], Any]")
foobar.py:9: error: Incompatible types in assignment (expression has type "float", variable has type "int")
foobar.py:11: error: Name 'baz' is not defined
Found 3 errors in 1 file (checked 1 source file)
Shell tools သင်ခန်းစာတွင် Shell script များအတွက် တူညီသော Tool ဖြစ်သည့် shellcheck အကြောင်းကို သင်ကြားခဲ့ကြပါသည်။
Editor နှင့် IDE အများစုသည် ဤ Tool များ၏ Output ကို Editor အတွင်း၌ တိုက်ရိုက် ပြသပေးခြင်းကို ထောက်ပံ့ပေးပြီး Warning နှင့် Error များကို Highlight ပြပေးပါသည်။ ဤသည်ကို code linting ဟု ခေါ်ဆိုကြပြီး စတိုင်လ် ပုံစံ ချိုးဖောက်မှုများ သို့မဟုတ် လုံခြုံရေး မရှိသော ရေးသားမှုများကိုပါ ပြသပေးနိုင်ပါသည်။
Vim တွင် ale သို့မဟုတ် syntastic plugin များက ထိုသို့ ပြုလုပ်ပေးပါသည်။
Python အတွက် pylint နှင့် pep8 တို့သည် စတိုင်လ် Linter များ ဖြစ်ကြပြီး bandit သည် အသုံးများသော လုံခြုံရေး ပြဿနာများကို ရှာဖွေရန် ဒီဇိုင်းထွင်ထားသော Tool ဖြစ်ပါသည်။
အခြား ဘာသာစကားများအတွက် အသုံးဝင်သော Static analysis စာရင်းများကို Awesome Static Analysis တွင် ကြည့်နိုင်ပြီး Linter များအတွက် Awesome Linters တွင် ကြည့်နိုင်ပါသည်။
Stylistic linting ကို ဖြည့်စွက်ပေးသော Tool များမှာ Python အတွက် black၊ Go အတွက် gofmt၊ Rust အတွက် rustfmt သို့မဟုတ် JavaScript, HTML, CSS အတွက် prettier ကဲ့သို့သော Code formatters များ ဖြစ်ကြပါသည်။
ဤ Tool များသည် သက်ဆိုင်ရာ ဘာသာစကား၏ စံနှုန်း စတိုင်လ် ပုံစံများအတိုင်း သင်၏ Code ကို အလိုအလျောက် Format ပြုလုပ်ပေးပါသည်။
Profiling
သင်၏ Code သည် မျှော်လင့်ထားသည့်အတိုင်း အလုပ်လုပ်သည့်တိုင်အောင် အလုပ်လုပ်နေစဉ်အတွင်း CPU သို့မဟုတ် Memory အားလုံးကို ယူဆောင်သွားပါက မလုံလောက်နိုင်ပါ။ Algorithm အတန်းများတွင် Big O notation အကြောင်းကို သင်ကြားပေးသော်လည်း ပရိုဂရမ်၏ Hot spots များကို မည်သို့ ရှာရမည်ကို မသင်ကြားပေးပါ။ အချိန်မတိုင်မီ အကောင်းဆုံးဖြစ်အောင် ပြုလုပ်ခြင်းသည် ဒုက္ခအားလုံး၏ အမြစ် ဖြစ်သောကြောင့် Profiler များ နှင့် Monitoring tool များကို လေ့လာသင့်ပါသည်။ ယင်းတို့သည် ပရိုဂရမ်၏ မည်သည့် အစိတ်အပိုင်းက အချိန် သို့မဟုတ် Resource အများဆုံး ယူနေသည်ကို နားလည်အောင် ကူညီပေးမည် ဖြစ်သဖြင့် ထို အစိတ်အပိုင်းများကို အဓိကထား အကောင်းဆုံးဖြစ်အောင် ပြုလုပ်နိုင်ပါမည်။
Timing
Debugging ကဲ့သို့ပင်၊ နေရာနှစ်ခုကြား ကြာမြင့်ချိန်ကို ရိုက်နှိပ်ကြည့်ခြင်းသည် အခြေအနေများစွာတွင် လုံလောက်နိုင်ပါသည်။
အောက်တွင် Python ရှိ time module ကို အသုံးပြုထားသော နမူနာ ဖြစ်ပါသည်။
import time, random
n = random.randint(1, 10) * 100

# Get current time
start = time.time()

# Do some work
print("Sleeping for {} ms".format(n))
time.sleep(n/1000)

# Compute time between start and now
print(time.time() - start)

# Output
# Sleeping for 500 ms
# 0.5713930130004883
သို့သော် နာရီကြည့် ကြာမြင့်ချိန် (Wall clock time) သည် အလှည့်အပတ် ဖြစ်နိုင်သည်၊ အကြောင်းမှာ ကွန်ပျူတာသည် အခြား Process များကို runနေနိုင်သလို Event များကို စောင့်ဆိုင်းနေနိုင်သောကြောင့် ဖြစ်သည်။ Tool များသည် Real, User နှင့် Sys time တို့ကို ခွဲခြားသတ်မှတ်လေ့ ရှိကြပါသည်။ ယေဘုယျအားဖြင့် User + Sys သည် ပရိုဂရမ်က CPU တွင် အမှန်တကယ် ကုန်လွန်ခဲ့သော အချိန်ကို ဖော်ပြပေးသည် (အသေးစိတ်ကို ဒီမှာ ကြည့်ပါ)။
- Real - ပရိုဂရမ် စတင်ချိန်မှ ပြီးဆုံးချိန်အထိ နာရီကြည့် ကုန်လွန်ချိန် (အခြား process များ နှင့် စောင့်ဆိုင်းချိန်များ ပါဝင်သည်)
- User - User code ကို runရာတွင် CPU ၌ ကုန်လွန်ခဲ့သော အချိန်
- Sys - Kernel code ကို runရာတွင် CPU ၌ ကုန်လွန်ခဲ့သော အချိန်
ဥပမာ HTTP request ပြုလုပ်သော Command တစ်ခု၏ ရှေ့တွင် time ထည့်၍ runကြည့်ပါ။ လိုင်းနှေးသောအခါ အောက်ပါအတိုင်း Output ရရှိနိုင်ပါသည်။ ဤနေရာတွင် Request ပြီးဆုံးရန် ၂ စက္ကန့်ကျော် ကြာမြင့်ခဲ့သော်လည်း Process သည် CPU user time 15ms နှင့် Kernel CPU time 12ms သာ ကုန်လွန်ခဲ့သည်။
$ time curl https://missing.csail.mit.edu &> /dev/null
real    0m2.561s
user    0m0.015s
sys     0m0.012s
Profilers
CPU
လူအများစုက profilers ဟု ပြောသည့်အခါ အသုံးအများဆုံးဖြစ်သော CPU profilers များကို ဆိုလိုခြင်း ဖြစ်သည်။ CPU profiler အဓိက အမျိုးအစား နှစ်ခု ရှိသည် - tracing နှင့် sampling profilers။ Tracing profiler များသည် ပရိုဂရမ် ပြုလုပ်သော Function call တိုင်းကို မှတ်တမ်းတင်ထားပြီး Sampling profiler များမူ ပရိုဂရမ်ကို ပုံမှန် အချိန်အပိုင်းအခြားအလိုက် (အများအားဖြင့် မီလီစက္ကန့်တိုင်း) စစ်ဆေး၍ Stack ကို မှတ်တမ်းတင်သည်။ ယင်းတို့သည် ပရိုဂရမ်က အချိန်အများဆုံး ကုန်လွန်ခဲ့သည့် စာရင်းဇယားများကို ပြသပေးပါသည်။ ဤဆောင်းပါး တွင် ပိုမို အသေးစိတ် လေ့လာနိုင်ပါသည်။
ပရိုဂရမ်မင်း ဘာသာစကား အများစုတွင် Code ကို ဆန်းစစ်ရန် Command line profiler ပါဝင်ကြပါသည်။
Python တွင် Function call တစ်ခုစီ၏ အချိန်ကို Profile ပြုလုပ်ရန် cProfile module ကို အသုံးပြုနိုင်ပါသည်။ အောက်ပါအတိုင်း Python ဖြင့် ရေးထားသော မူလ Grep နမူနာ ဖြစ်ပါသည် -
#!/usr/bin/env python

import sys, re

def grep(pattern, file):
    with open(file, 'r') as f:
        print(file)
        for i, line in enumerate(f.readlines()):
            pattern = re.compile(pattern)
            match = pattern.search(line)
            if match is not None:
                print("{}: {}".format(i, line), end="")

if __name__ == '__main__':
    times = int(sys.argv[1])
    pattern = sys.argv[2]
    for i in range(times):
        for file in sys.argv[3:]:
            grep(pattern, file)
အောက်ပါ Command ဖြင့် ဤ Code ကို Profile ပြုလုပ်နိုင်ပါသည်။ Output ကို ဆန်းစစ်ကြည့်ပါက IO က အချိန်အများဆုံး ယူနေပြီး Regex အား Compile လုပ်ခြင်းကလည်း အချိန်အတော်အတန် ယူနေသည်ကို တွေ့ရမည်။ Regex ကို တစ်ကြိမ်သာ Compile လုပ်ရန် လိုသဖြင့် Loop အပြင်သို့ ထုတ်ယူနိုင်ပါသည်။
$ python -m cProfile -s tottime grep.py 1000 '^(import|\s*def)[^,]*$' *.py

[omitted program output]

 ncalls  tottime  percall  cumtime  percall filename:lineno(function)
     8000    0.266    0.000    0.292    0.000 {built-in method io.open}
     8000    0.153    0.000    0.894    0.000 grep.py:5(grep)
    17000    0.101    0.000    0.101    0.000 {built-in method builtins.print}
     8000    0.100    0.000    0.129    0.000 {method 'readlines' of '_io._IOBase' objects}
    93000    0.097    0.000    0.111    0.000 re.py:286(_compile)
    93000    0.069    0.000    0.069    0.000 {method 'search' of '_sre.SRE_Pattern' objects}
    93000    0.030    0.000    0.141    0.000 re.py:231(compile)
    17000    0.019    0.000    0.029    0.000 codecs.py:318(decode)
        1    0.017    0.017    0.911    0.911 grep.py:3(<module>)

[omitted lines]
Python ၏ cProfile ၏ အားနည်းချက်တစ်ခုမှာ Function call တစ်ခုစီအလိုက် အချိန်ကို ပြသခြင်း ဖြစ်သည်။ အထူးသဖြင့် Third-party library များကို သုံးသည့်အခါ ရှုပ်ထွေးသွားနိုင်ပါသည်။
ပိုမို ရှင်းလင်းသော နည်းလမ်းမှာ Code စာကြောင်း တစ်ကြောင်းစီအလိုက် ကုန်လွန်ချိန်ကို ပြသခြင်း ဖြစ်ပြီး line profilers များက ထိုသို့ ပြုလုပ်ပေးပါသည်။
ဥပမာ အောက်ပါ Python code သည် အတန်း ဝဘ်ဆိုက်သို့ Request ပို့ပြီး URL များကို စစ်ထုတ်ယူပါသည် -
#!/usr/bin/env python
import requests
from bs4 import BeautifulSoup

# This is a decorator that tells line_profiler
# that we want to analyze this function
@profile
def get_urls():
    response = requests.get('https://missing.csail.mit.edu')
    s = BeautifulSoup(response.content, 'lxml')
    urls = []
    for url in s.find_all('a'):
        urls.append(url['href'])

if __name__ == '__main__':
    get_urls()
Python ၏ cProfile ကို သုံးပါက Output စာကြောင်း ၂၅၀၀ ကျော် ရရှိမည် ဖြစ်သည်။ line_profiler ကို runလိုက်ပါက စာကြောင်းတစ်ကြောင်းစီ၏ အချိန်ကို တွေ့ရမည် -
$ kernprof -l -v a.py
Wrote profile results to urls.py.lprof
Timer unit: 1e-06 s

Total time: 0.636188 s
File: a.py
Function: get_urls at line 5

Line #  Hits         Time  Per Hit   % Time  Line Contents
==============================================================
 5                                           @profile
 6                                           def get_urls():
 7         1     613909.0 613909.0     96.5      response = requests.get('https://missing.csail.mit.edu')
 8         1      21559.0  21559.0      3.4      s = BeautifulSoup(response.content, 'lxml')
 9         1          2.0      2.0      0.0      urls = []
10        25        685.0     27.4      0.1      for url in s.find_all('a'):
11        24         33.0      1.4      0.0          urls.append(url['href'])
Memory
C သို့မဟုတ် C++ ကဲ့သို့သော ဘာသာစကားများတွင် Memory leaks များသည် မလိုအပ်တော့သော Memory များကို ပယ်ဖျက်မပေးဘဲ ဖြစ်စေနိုင်ပါသည်။ Memory debugging အတွက် Valgrind ကဲ့သို့သော Tool များကို အသုံးပြု၍ Memory leaks များကို ရှာဖွေနိုင်ပါသည်။
Python ကဲ့သို့ Garbage collected ဘာသာစကားများတွင်လည်း Memory profiler ကို သုံးရန် အသုံးဝင်ပါသည်၊ အကြောင်းမှာ Memory ထဲရှိ Object များသို့ Pointer များ ရှိနေသရွှေ့ Garbage collection ပြုလုပ်မည် မဟုတ်သောကြောင့် ဖြစ်သည်။ အောက်တွင် memory-profiler ဖြင့် runထားသော နမူနာ ဖြစ်ပါသည် -
@profile
def my_func():
    a = [1] * (10 ** 6)
    b = [2] * (2 * 10 ** 7)
    del b
    return a

if __name__ == '__main__':
    my_func()
$ python -m memory_profiler example.py
Line #    Mem usage  Increment   Line Contents
==============================================
     3                           @profile
     4      5.97 MB    0.00 MB   def my_func():
     5     13.61 MB    7.64 MB       a = [1] * (10 ** 6)
     6    166.20 MB  152.59 MB       b = [2] * (2 * 10 ** 7)
     7     13.61 MB -152.59 MB       del b
     8     13.61 MB    0.00 MB       return a
Event Profiling
Debugging အတွက် strace ကဲ့သို့ပင်၊ Profile ပြုလုပ်သည့်အခါ Code ၏ အသေးစိတ်ကို လျစ်လျူရှုပြီး Black box အဖြစ် သတ်မှတ်လိုနိုင်ပါသည်။
perf Command သည် CPU ကွဲပြားမှုများကို ကျော်လွန်၍ Time သို့မဟုတ် Memory မဟုတ်ဘဲ System events များကို အစီရင်ခံပေးပါသည်။
ဥပမာ perf သည် နည်းပါးသော Cache locality၊ များပြားသော Page faults များကို အလွယ်တကူ ပြသပေးနိုင်ပါသည်။
perf list- perf ဖြင့် ခြေရာခံနိုင်သော Event စာရင်းများကို ပြသည်perf stat COMMAND ARG1 ARG2- Process သို့မဟုတ် Command နှင့် သက်ဆိုင်သော Event ရေတွက်မှုများကို ရယူသည်perf record COMMAND ARG1 ARG2- Command ၏ runမှုကို မှတ်တမ်းတင်၍perf.dataဖိုင်ထဲ သိမ်းဆည်းသည်perf report-perf.dataရှိ အချက်အလက်များကို ပြသပေးသည်
Visualization
စက္ကူပေါ်မှ Profiler output များသည် အလွန် များပြားနိုင်ပါသည်။ လူများသည် ပုံရိပ်ကြည့် သတ္တဝါများ ဖြစ်ကြပြီး ကိန်းဂဏန်း အများအပြားကို ဖတ်ရသည်ကို သဘောမကျကြပါ။ ထို့ကြောင့် Profiler output များကို လွယ်ကူစွာ ကြည့်ရှုနိုင်သည့် Tool များ ရှိကြပါသည်။
အသုံးများသော နည်းလမ်းတစ်ခုမှာ Y axis တွင် Function call အစဉ်လိုက်နှင့် X axis တွင် ကြာမြင့်ချိန်ကို ပြသပေးသော Flame Graph ကို အသုံးပြုခြင်း ဖြစ်ပါသည်။
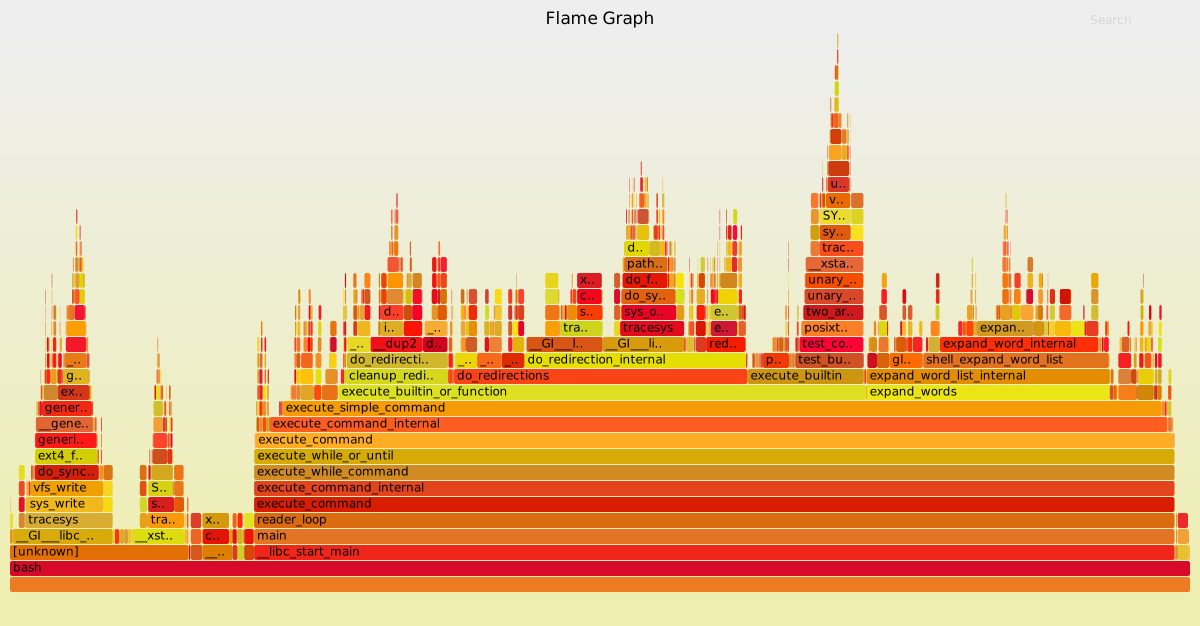
Call graph သို့မဟုတ် Control flow graph များသည် Function များကို Node များအဖြစ်နှင့် Call များကို Directed Edge များအဖြစ် ပြသပေးပါသည်။
Python တွင် pycallgraph library ဖြင့် ယင်းတို့ကို ထုတ်ယူနိုင်ပါသည်။

Resource Monitoring
တစ်ခါတစ်ရံ ပရိုဂရမ်၏ စွမ်းဆောင်ရည်ကို ဆန်းစစ်ရန် ပထမအဆင့်မှာ ယင်း၏ အမှန်တကယ် Resource စားသုံးမှုကို နားလည်ခြင်း ဖြစ်သည်။ CPU usage, Memory usage, Network, Disk usage များကို ကြည့်ရှုရန် Command line tool များစွာ ရှိပါသည် -
- General Monitoring - အသုံးအများဆုံးမှာ
top၏ ပိုမိုကောင်းမွန်သော မူကွဲဖြစ်သည့်htopဖြစ်သည်။<F6>ဖြင့် Process များ စီနိုင်သည်၊tဖြင့် Tree ပြနိုင်သည်၊hဖြင့် Thread များ ပိတ်/ဖွင့် နိုင်သည် ။ UI ကောင်းမွန်သောglancesကိုလည်း ကြည့်ပါ၊ Real-time resource metric များအတွက်doolလည်း ရှိသည်။ - I/O operations -
iotopသည် လက်ရှိ I/O အသုံးပြုမှုကို ပြသသည်။ - Disk Usage -
dfသည် Partition အလိုက် ပြသပြီးduသည် ဖိုင်အလိုက် disk usage ကို ပြသည်။-hflag ဖြင့် Human readable format ရနိုင်သည်။ ၎င်းထက် ပိုမို အဆင်ပြေသော Interactive မုဒ်မှာncduဖြစ်သည်။ - Memory Usage -
freeသည် စနစ်၏ မလွတ်သေးသော နှင့် လွတ်နေသော Memory ကို ပြသည်။ - Open Files -
lsofသည် Process များ ဖွင့်ထားသော ဖိုင် သတင်းအချက်အလက်များကို စာရင်းပြသည်။ - Network Connections and Config -
ssသည် Network packet စာရင်းဇယားများကို စောင့်ကြည့်နိုင်ပြီး သီးခြား Port ကို မည်သည့် Process သုံးနေသည်ကို ရှာနိုင်သည်။ Routing နှင့် Interface များအတွက်ipကို သုံးနိုင်သည်။ - Network Usage -
nethogsနှင့်iftopတို့သည် Network အသုံးပြုမှုကို စောင့်ကြည့်ရန် ကောင်းမွန်သော Interactive CLI tool များ ဖြစ်သည်။
စမ်းသပ်ရန်အတွက် stress command ဖြင့် Load များကို ဖန်တီးနိုင်ပါသည်။
Specialized tools
Black box benchmarking ပြုလုပ်ရန် hyperfine ကဲ့သို့သော Tool များကို သုံး၍ Command line ပရိုဂရမ်များကို အမြန် စမ်းသပ်နိုင်ပါသည်။
$ hyperfine --warmup 3 'fd -e jpg' 'find . -iname "*.jpg"'
Benchmark #1: fd -e jpg
  Time (mean ± σ):      51.4 ms ±   2.9 ms    [User: 121.0 ms, System: 160.5 ms]
  Range (min … max):    44.2 ms …  60.1 ms    56 runs

Benchmark #2: find . -iname "*.jpg"
  Time (mean ± σ):      1.126 s ±  0.101 s    [User: 141.1 ms, System: 956.1 ms]
  Range (min … max):    0.975 s …  1.287 s    10 runs

Summary
  'fd -e jpg' ran
   21.89 ± 2.33 times faster than 'find . -iname "*.jpg"'
Browser များတွင်လည်း စွမ်းဆောင်ရည် စမ်းသပ်ရန် Tool များစွာ ပါဝင်ပါသည် (Firefox နှင့် Chrome)။
Exercises
Debugging
-
Linux တွင်
journalctlသို့မဟုတ် macOS တွင်log showကို သုံး၍ လွန်ခဲ့သော နေ့ရက်အတွင်း Superuser ဝင်ရောက်မှုများကို ကြည့်ပါ။ မရှိပါကsudo lsrunပြီး ပြန်စစ်ပါ။ -
pdbသင်ခန်းစာ ကို ပြုလုပ်ပါ။ ဤဆောင်းပါး ကိုလည်း ဖတ်ပါ။ -
shellcheckကို တပ်ဆင်ပြီး အောက်ပါ Script ကို စစ်ဆေးပါ။ ဘာမှားနေသနည်း ပြင်ပါ။#!/bin/sh ## Example: a typical script with several problems for f in $(ls *.m3u) do grep -qi hq.*mp3 $f \ && echo -e 'Playlist $f contains a HQ file in mp3 format' done -
(အဆင့်မြင့်) Reversible debugging အကြောင်း ဖတ်ပြီး
rrသို့မဟုတ်RevPDBကို သုံးပါ။
Profiling
-
ဒီမှာ Sorting algorithm များ ရှိပါသည်။
cProfileနှင့်line_profilerတို့ကို သုံး၍ Insertion sort နှင့် Quicksort ကြာမြင့်ချိန် ယှဉ်ပါ။memory_profilerကို သုံး၍ Memory စားသုံးမှုကို စစ်ပါ။ -
အောက်ပါ Python code ဖြင့် Fibonacci ကိန်းများ တွက်ချက်ပုံကို လေ့လာပါ -
#!/usr/bin/env python
def fib0(): return 0

def fib1(): return 1

s = """def fib{}(): return fib{}() + fib{}()"""

if __name__ == '__main__':

    for n in range(2, 10):
        exec(s.format(n, n-1, n-2))
    # from functools import lru_cache
    # for n in range(10):
    #     exec("fib{} = lru_cache(1)(fib{})".format(n, n))
    print(eval("fib9()"))
pycallgraph graphviz -- ./fib.pyဖြင့် run၍pycallgraph.pngကို စစ်ပါ။fib0ကို ဘယ်နှစ်ကြိမ် ခေါ်သနည်း။ Comment ဖြုတ်၍ ပြန်runပါ၊ အခု ဘယ်နှစ်ကြိမ် ခေါ်သနည်း။ -
Port 4444 တွင်
python -m http.server 4444စတင် runပါ။ အခြား Terminal မှlsof | grep LISTENဖြင့် စစ်ပါ၊ PID ကို ရှာပြီးkill <PID>ဖြင့် ပိတ်ပါ။ -
stress -c 3runပြီးhtopဖြင့် ကြည့်ပါ။taskset --cpu-list 0,2 stress -c 3runပြီး ကြည့်ပါ။man tasksetကို ဖတ်ပါ။ စိန်ခေါ်မှု-cgroupsကို သုံး၍ ပြုလုပ်ပါ။stress -mဖြင့် memory စားသုံးမှုကို ကန့်သတ်ကြည့်ပါ။ -
(အဆင့်မြင့်)
curl ipinfo.iorunပြီး Wireshark ဖြင့် Packet များကို ဖမ်းယူကြည့်ပါ (httpfilter သုံးပါ)။
Licensed under CC BY-NC-SA.